📄 Summary: What You’ll Learn in This Article
This article explains the purpose, key functionalities, access options, and frequently asked questions related to the Dashboard Module in Marmind, helping users effectively visualize and analyze marketing budgets, forecasts, and KPIs.
-
Location of the Dashboard module
-
General applications of the Dashboard module
🧑🤝🧑 Who Should Read This?
This article is most useful for:
-
Marketing Professionals, Marketing Operations Managers, Business leaders who are interested in Marmind’s features
-
New Marmind Users
✔️ Prerequisites: What Should You Know Before Getting Started?
Level: Easy
Access required: None
-
No prior knowledge is required. This is an introductory article for those exploring Marmind for the first time.
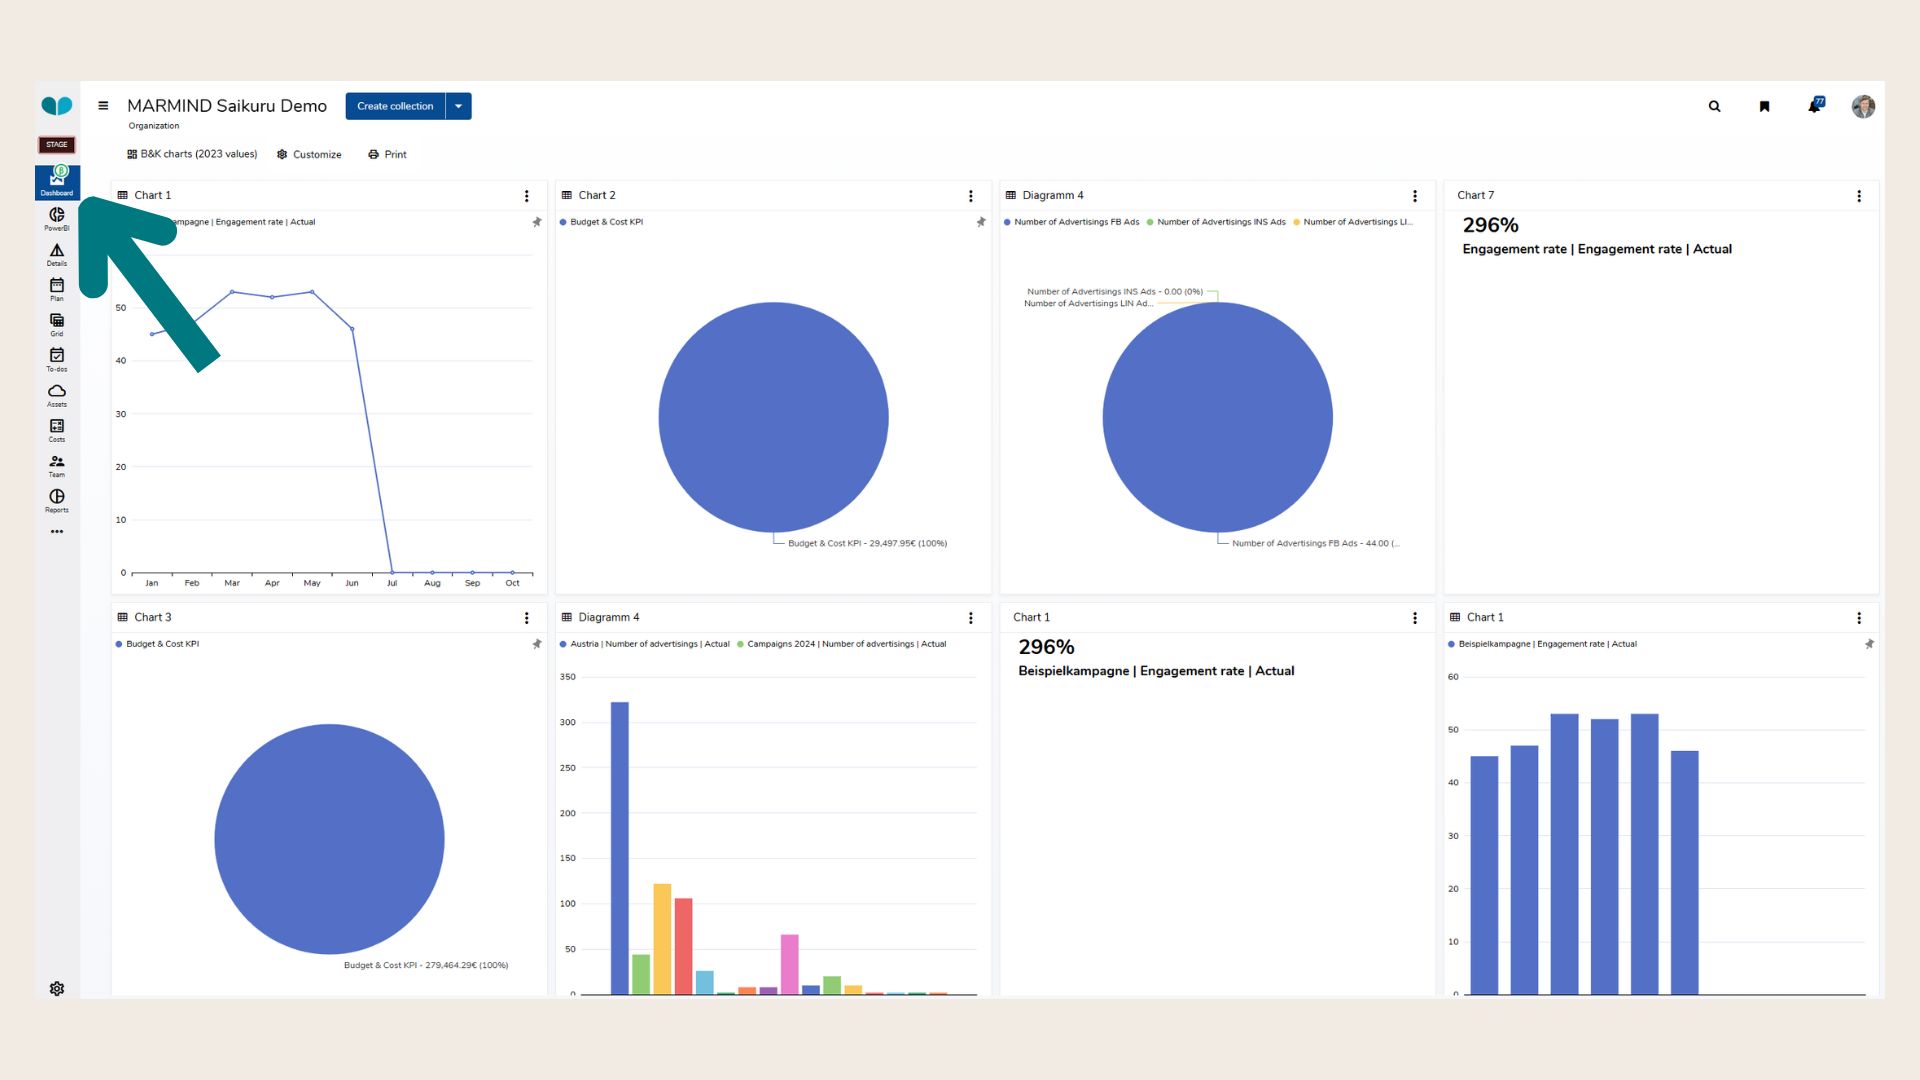
Where to find the Dashboard Module
You can access the Dashboard Module directly via the module bar on the left-hand side of the Marmind interface. It is usually the top-most module in the list, and opens in a dedicated workspace.
What is the Dashboard module generally used for?
The Dashboard Module in Marmind is a powerful analytics and visualization tool used to monitor, compare, and present key marketing data based on previously defined KPIs. By enabling dynamic chart creation and customizable dashboards, it empowers users to make informed, data-driven decisions.
-
Custom Chart Collections
Users can build and manage collections of visual charts with shared layout and access settings. Collections can be private or shared with specific team members. -
Smart Charts
These automatically update when you switch context (e.g., from one campaign or channel to another). -
Chart Wizard
A guided four-step process for creating static or dynamic, context-sensitive charts. When creating a Smart Chart, you’ll be guided through four steps. First, choose the chart type you want to use, such as a bar, line, or pie chart. Next, define which Marmind objects the chart should include and apply any additional filters to narrow down your data. In the third step, select the KPIs you want to display, like budget, costs, or forecast. Finally, choose how to group the data and adjust the formatting options in the Settings tab to customize the chart’s appearance. -
Supported Chart Types
Choose from bar charts, stacked bars, pie charts, line charts, stacked lines, KPI value tiles, and more - each offering tailored visual representation of marketing data. -
KPI Integration
Budgets, forecasts, and variance KPIs can be visualized by month, quarter, or year. Chart intervals and aggregation levels are flexible and adjustable. -
Layout Editing
Adjust chart positioning and sizing in a drag-and-drop grid layout. Use “Layout edit” mode for intuitive reorganization of dashboard content. -
Advanced Sharing Controls
Define owners, control edit permissions, and share collections with users inside or outside the hierarchy context. Shared users can view or copy dashboards as needed. -
Chart Preview & Formatting
Preview charts before adding them and customize titles, axis formats, legends, colors, and series types. Choose between diagram and data table views. -
Live Data and Refresh
When using the Smart Chart option, charts dynamically refresh when context changes. A manual refresh option is also available for on-demand updates.
❓ FAQs