📄 Summary: What You’ll Learn in This Article
This article explains how data is structured, displayed, and interacted with in Marmind’s Grid Module. You’ll discover how attributes are arranged across columns, how the object hierarchy is visualized, and how to navigate, sort, and edit efficiently within the grid.
-
Overview of the Grid Structure
-
Display Logic
-
Navigation
🧑🤝🧑 Who Should Read This?
This article is most useful for:
-
Marketing teams working with campaigns, projects, and actions in tabular formats
-
Operational leads looking to edit or analyze many items at once
-
Anyone who prefers Excel-style navigation for planning
✔️ Prerequisites: What Should You Know Before Getting Started?
Level: Easy
Access required: None
-
Basic familiarity with Marmind's object structure (Workspaces, Campaigns, Projects, Actions) is recommended.
How the Grid is Structured
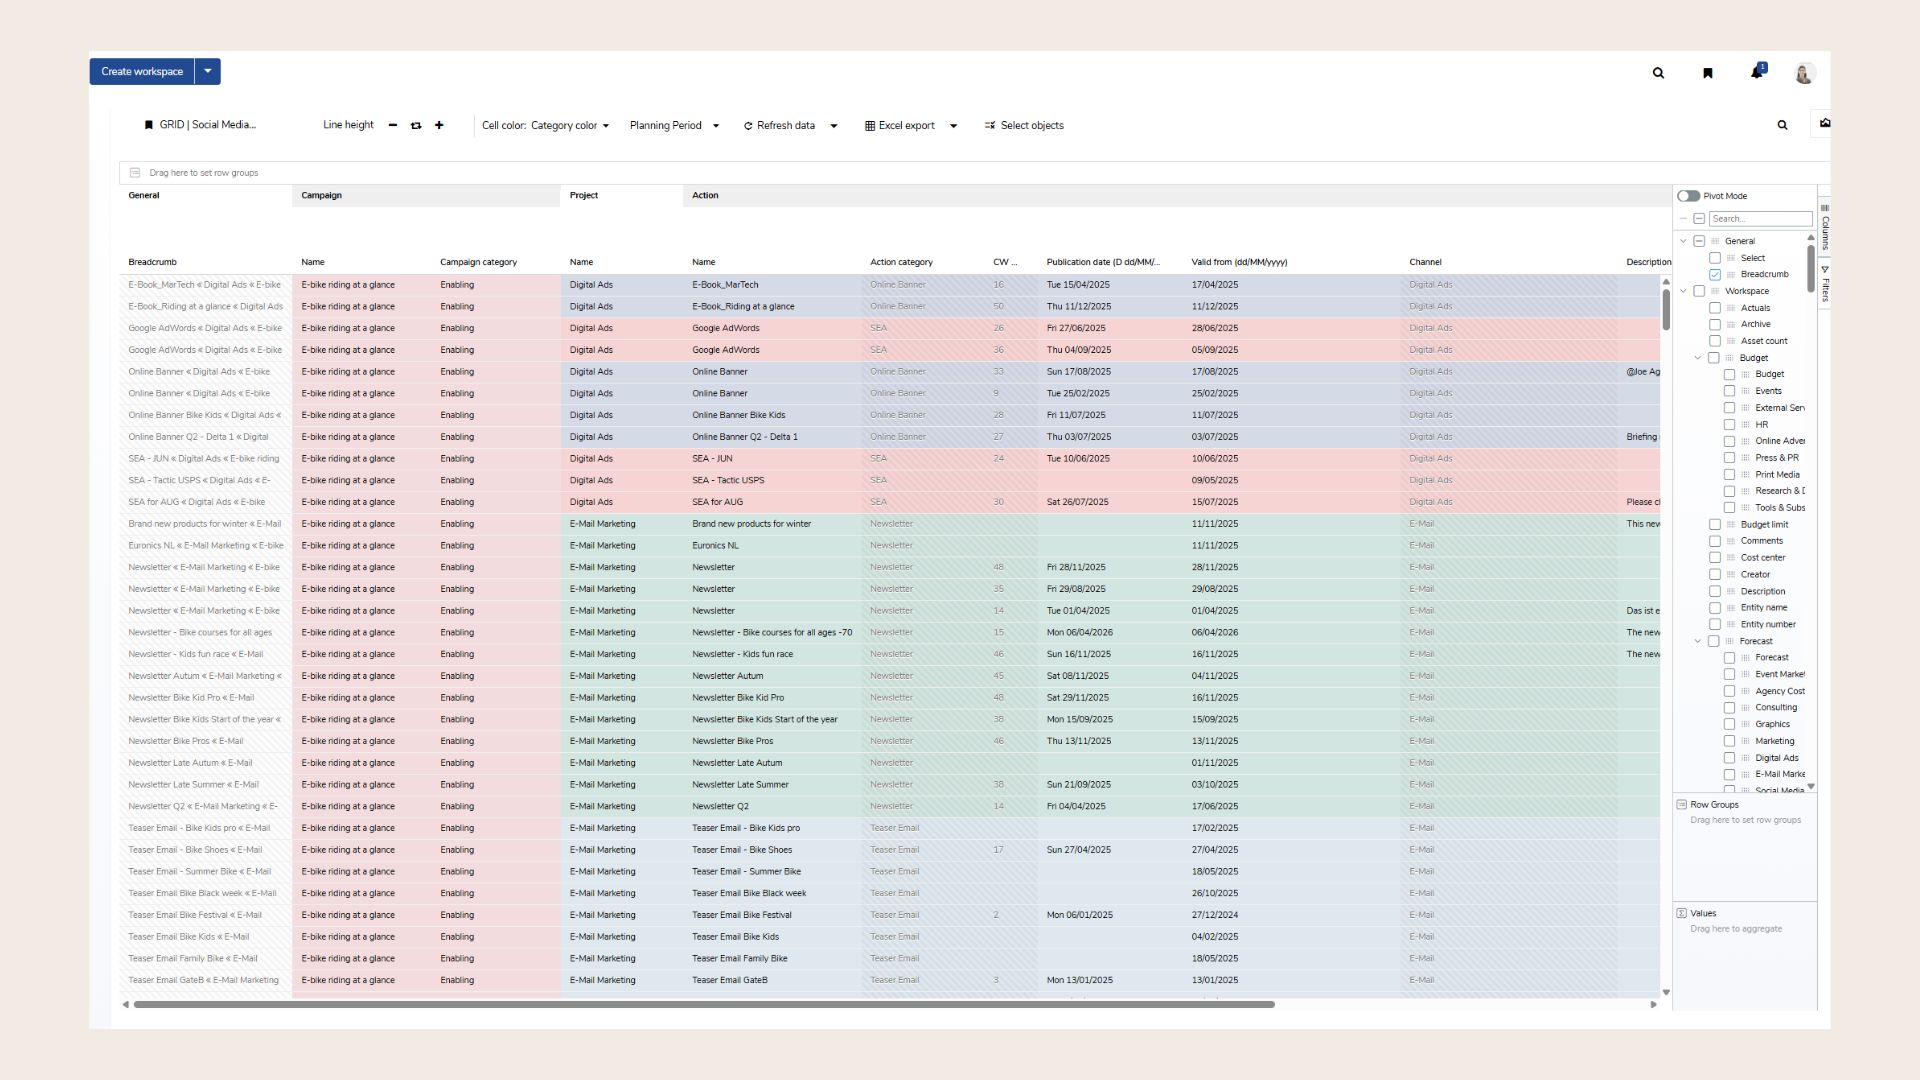
Rows = Objects
Each row in the grid represents a marketing object such as a campaign, project, or action. The order of rows reflects the object hierarchy—mirroring the structure you see in the navigation tree.
Columns = Attributes
Each column represents a selected attribute (or field) such as “Name,” “Responsible,” or “Status.” These are the same fields you’ll recognize from the Details view of a marketing object.
At the top of each column, you’ll see the object type that the attribute belongs to—for example, whether the "Status" column applies to Campaigns or Actions.
Repeated Attributes for Context
Because the grid displays the smallest structural unit (often an Action), attributes from higher-level objects (like Campaigns or Workspaces) may appear multiple times in the list—repeated for each row that belongs to a lower-level object.
Default Sorting and Display Logic
-
All objects are sorted vertically by their type and follow the order of the navigation tree.
-
Hierarchy in one row: The grid displays the first item of each object type horizontally in a single line. The remaining objects are listed vertically beneath it.
This creates a tree-like layout where nested objects remain connected through their contextual row placement.
Find user defined sorting here: https://marmind.atlassian.net/wiki/spaces/MPII/pages/352124996/Grid+Module+View+Settings#Sorting
Basic Operation and Navigation
Editing Data
To edit any cell:
-
Double-click the cell
-
Make your changes
-
Click “Save”
Selecting Rows
-
CTRL/STRG + click to select multiple rows for bulk actions
-
Space bar to select or deselect a highlighted row
Scrolling
-
Vertical: Scroll wheel or two-finger gesture
-
Horizontal:
-
Hold SHIFT + scroll wheel
-
Or use two-finger gesture on a touchpad
-
Or use the visible horizontal scroll bar
-
Note: Make sure your mouse pointer is within the grid area to activate scrolling.
Keyboard Shortcuts
-
Tab / Shift + Tab: Move right / left
-
Arrow Keys: Navigate one cell in any direction
-
CTRL/STRG + Arrow Keys: Jump to the beginning or end of the row/column
-
Enter: Edit and save
-
Escape: Cancel editing
The Pivot Function
The pivot function in the grid is used to condense and analyze numerical data.
It works similarly to a pivot table in Excel.
Typical use cases:
-
Summing up (e.g., total costs of a campaign).
-
Calculating averages (e.g., average number of newsletter recipients).
-
Counting (e.g., number of actions within a campaign).
-
Finding min/max values (e.g., lowest vs. highest KPI value).
-
Creating cross tables to compare recurring master data (e.g., target groups, countries) across campaigns.
How to Use the Pivot Function
Activate pivot mode
-
Switch the toggle on in the top right of the grid.
-
The view resets → you start from scratch.
-
From this point on, added fields are interpreted as groups.
Build groups
-
Start by adding fields in the checkbox containing text information.
-
When you add a second field a new structure will be created and reproduces the hierarchy in the grid, eg. Campaign → Project → Action.
-
Your chosen fields will appear additionally in the Box “Row groups”
Add numerical fields
-
Start by selecting fields in the checkbox that contain numeric information, e.g., recipients (newsletters), actual costs, or planned values.
-
You can add additional value fields that you want to calculate with.
-
The fields you select will appear in the “Values” box and will be displayed in the grid.
Choose aggregation
by clicking on the value in the value box in you can choose a aggregation option:
Options include:
-
Average – calculates the mean value
-
Count – counts the items.
-
Sum – adds all values per group.
-
Min - displays the lowest value
-
Max - displays the highest value
-
First - eg. first recorded value of data set
-
Last - eg. latest recorded value of data set
.png?cb=14b75efc614ad57fcc7bc6ee0ab6f150)
Create cross tables
-
on the top of the grid appears a row that contains your choosen groups. By drag and drop certain attributes into the right collum you can create a cross table.
-
Cross tables can be used for reused master data that appears in many different objects eg. how target groups behaving across countries and campaigns shown in one table.
-
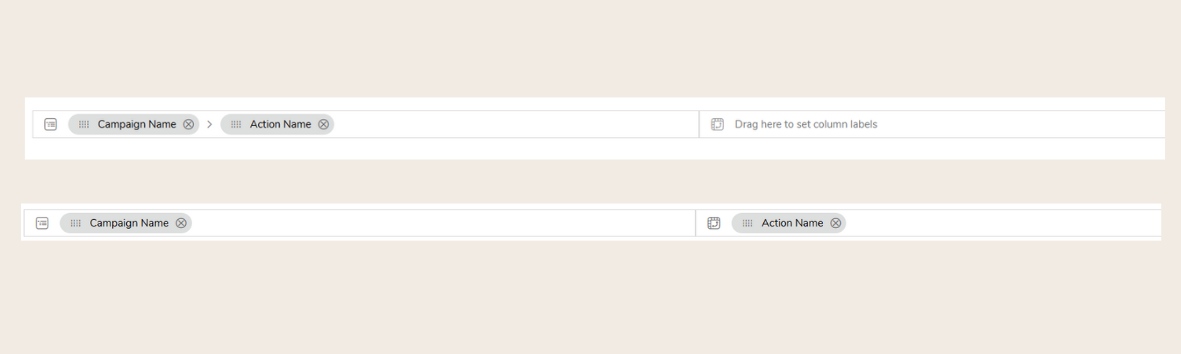
Cross Tables in Grid
Best Practices & Tips
-
Start with a flat list: Don’t begin with pivot or complex structures right away. First, build a simple list to get a better basic understanding.
-
Always start with the name column: The first column should be the object’s name. Select columns that are immediately clear (e.g. name, validity). This way, you immediately see the data set you’re working with and can identify objects faster by their names. Don’t begin with too many technical field names.
-
Select object deliberately: When building, consider: Which object types do I want to see (e.g. campaigns, projects, actions)? Don’t load everything at once, add it step by step.
-
Add a breadcrumb column: Place the breadcrumb column either at the beginning or the end of the table. The advantage is that you can jump directly from the table to the detail object without searching in the tree. This works like a clickable path (similar to Windows Explorer).
-
Open custom fields in parallel: Field names in the grid can be hard to find (or differ per customer). It’s recommended to open the object in the tree in parallel, read the field names you want to display in the grid and search for the field names in the grid. Every filed name of an object can be found in the search function.
-
Rebuild your most used Excel File: Often it helps at the beginning to bring Excel sheets with specific insights. These can easily be rebuilt and replicated in the grid.
❓ FAQs