📄 Summary: What You’ll Learn in This Article
This article explains how to create and configure a chart collection and introduces the different chart types.
-
Step-by-step guide on how to create a chart collection
🧑🤝🧑 Who Should Read This?
This article is most useful for:
-
Team Leads / Department Heads
Users who want to create customized dashboards to monitor performance or KPIs for their team or area of responsibility. -
Project Managers
Those who need to track project progress, budgets, or timelines using visual dashboards. -
Analysts / Power Users
Users with a deeper understanding of the data and hierarchy structures, who regularly build and share insights via charts. -
System Trainers / Internal Champions
People responsible for onboarding others or maintaining best practices around dashboard usage.
✔️ Prerequisites: What Should You Know Before Getting Started?
Level: Easy
Access required: None
The following prior knowledge is useful for this article:
-
Basic Navigation in Marmind
-
Understanding of Hierarchy Contexts
-
User Permissions and Access Rights
-
General Concept of Dashboards and Charts
Step-by-Step Guide
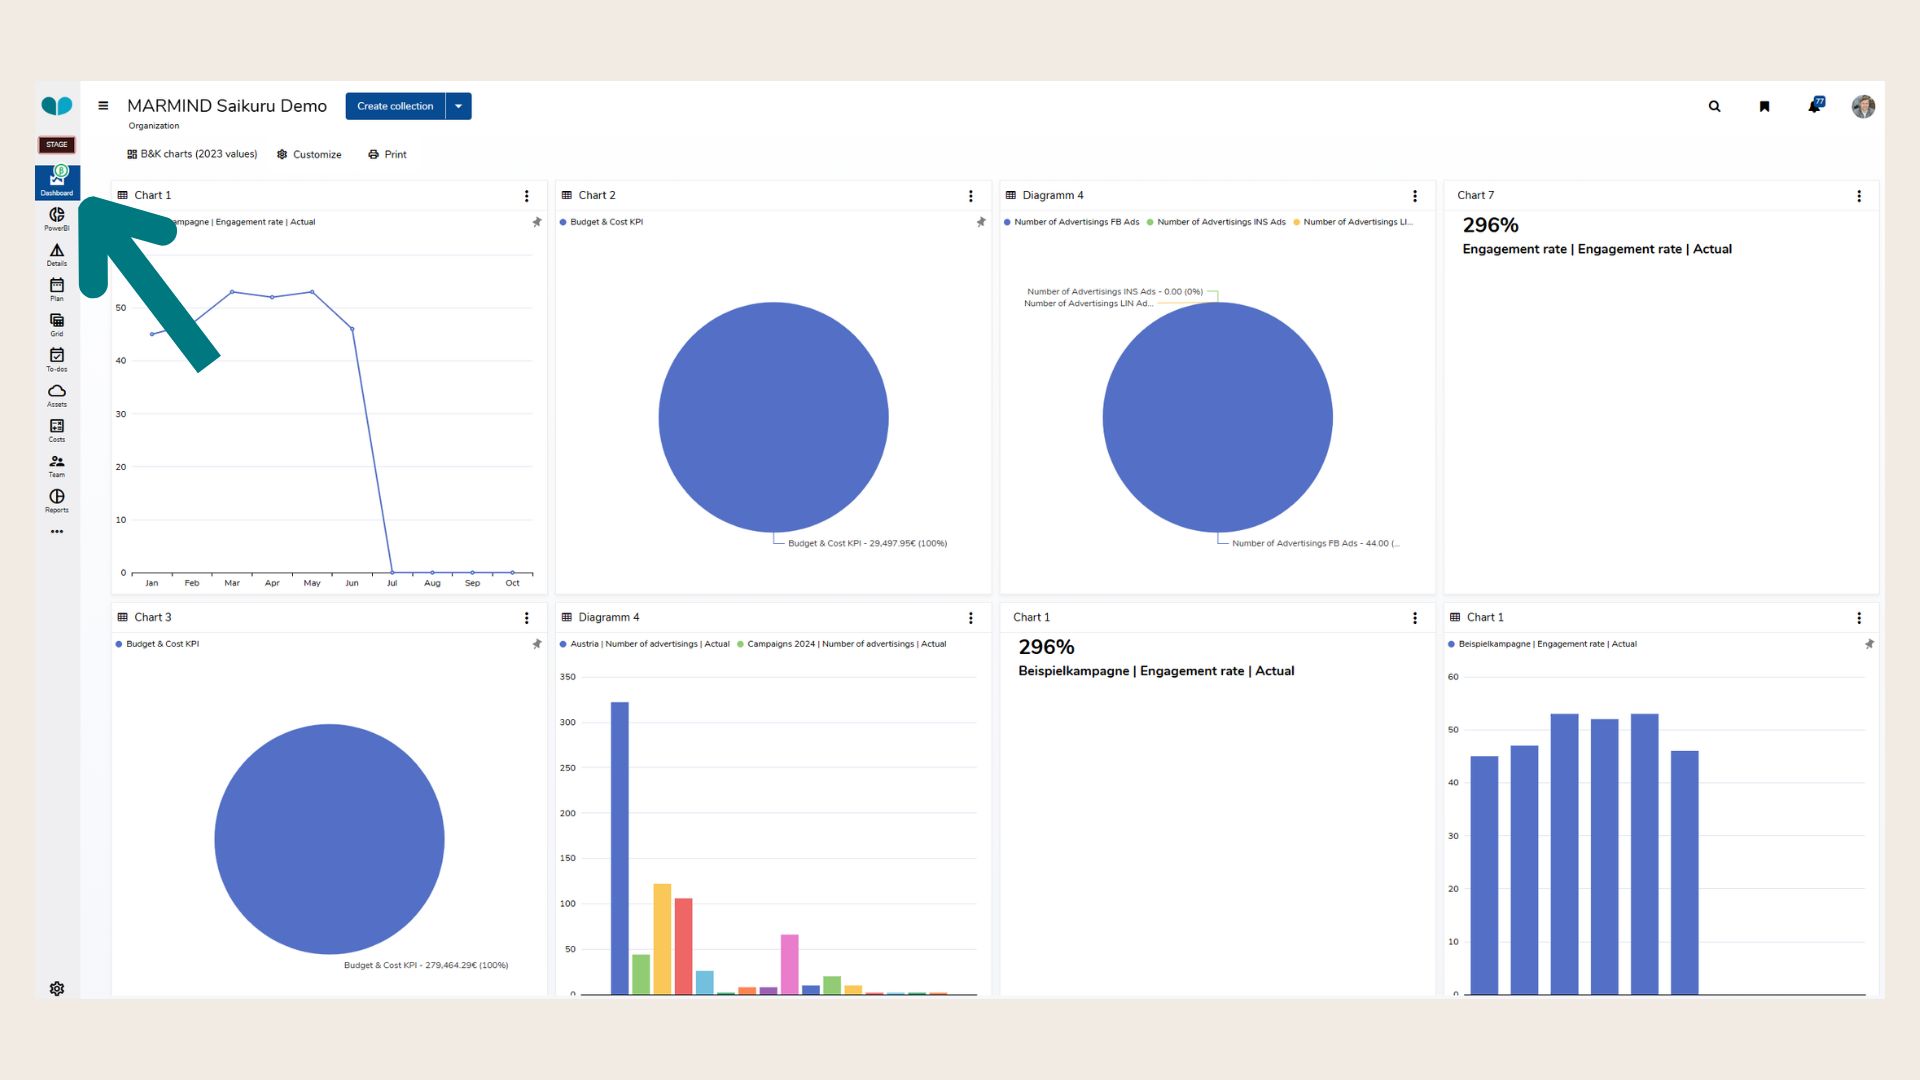
Step 1: Open the Dashboard Module
Navigate to the Dashboard in the main navigation of Marmind. If no collections exist yet, an empty screen will appear.
Step 2: Click the Blue “Create” Button
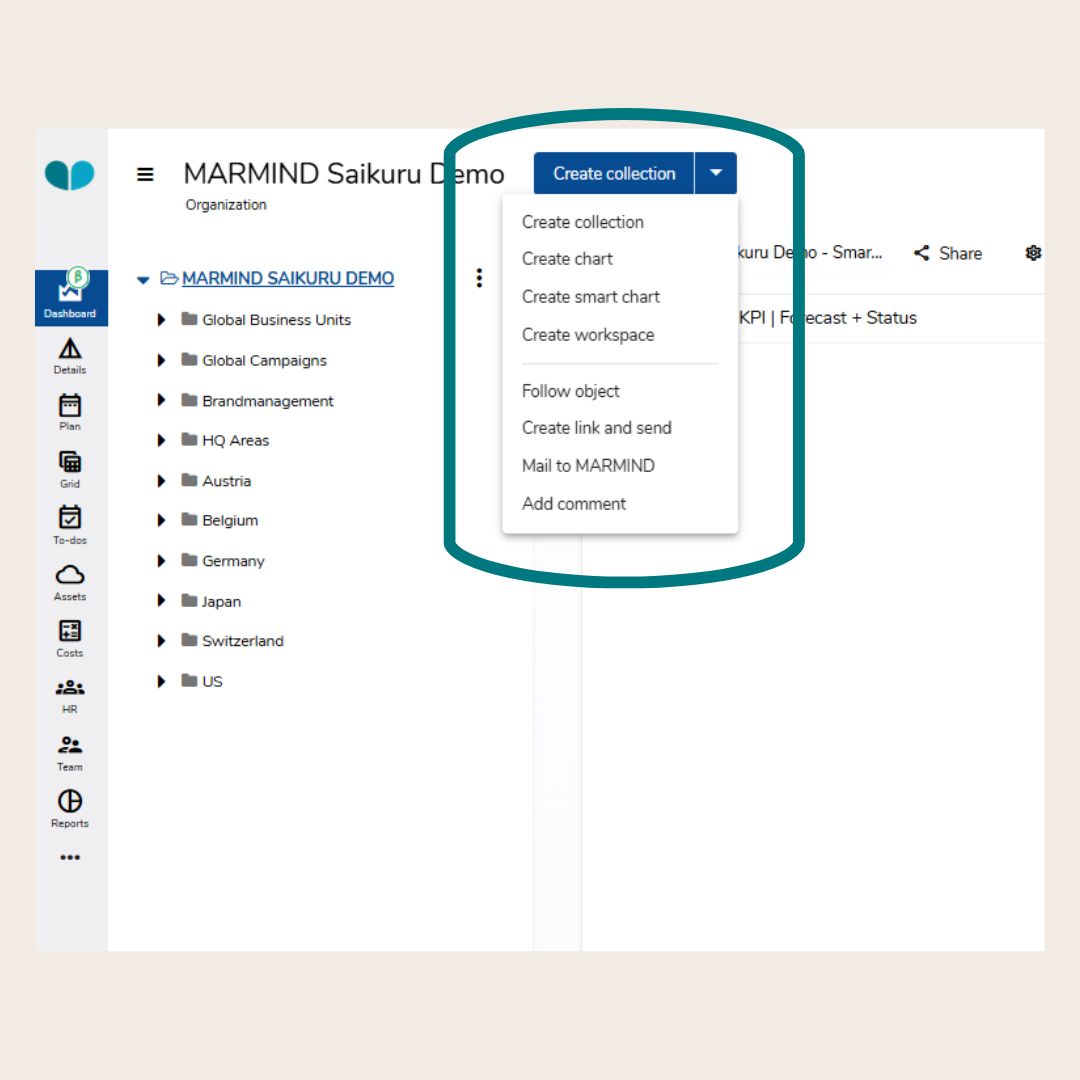
In the top-right corner, click the blue button. You’ll see three options:
-
Create collection – To create a new chart collection.
-
Create smart chart – To add a dynamic chart that adapts to the selected context.
-
Create workspace - To create a new workspace.
Click “Create collection” to begin.
Note: Regular charts have been deprecated in March 2026.
Step 3: Fill in Collection Details
A dialogue will open asking for the following information:
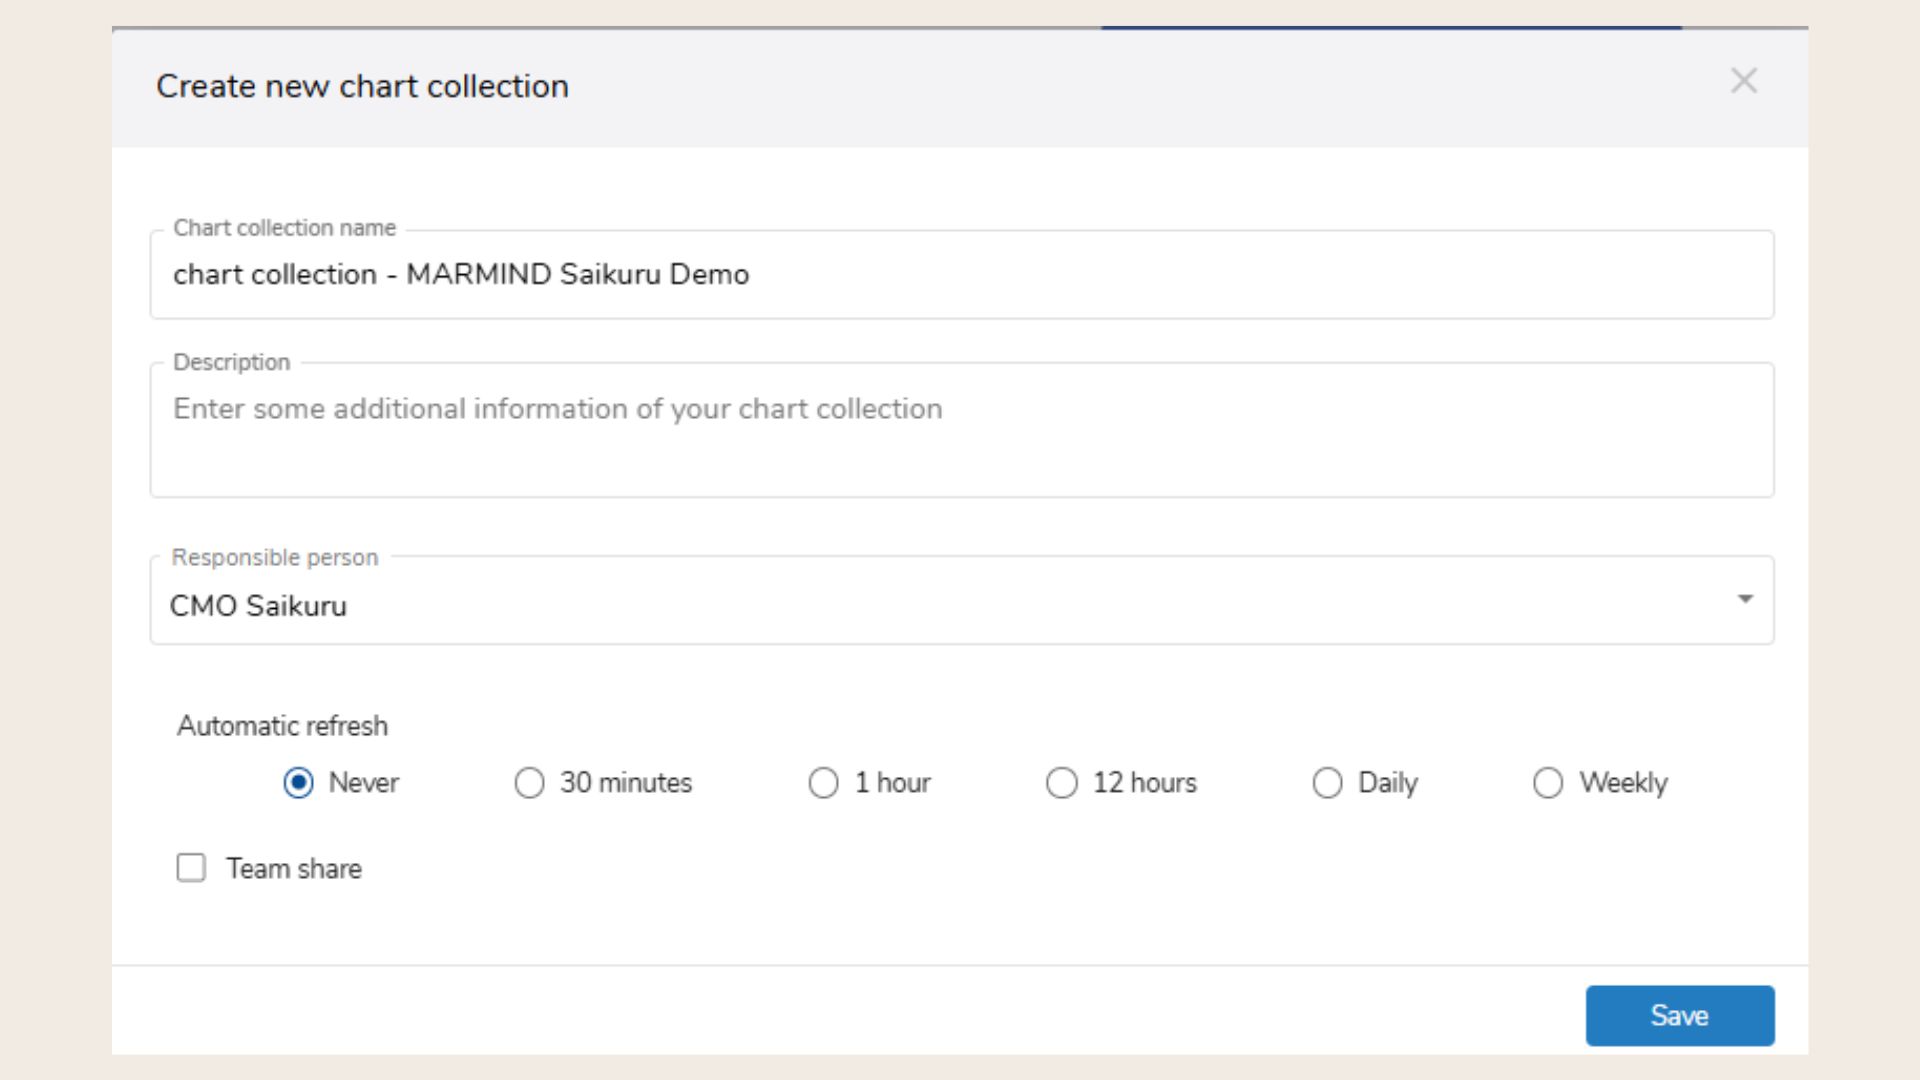
Chart collection name: Give your collection a clear, descriptive, and unique name.
Description (optional): Add context or extra info. Helpful if you’re sharing the collection.
Responsible person: Choose the person who owns and manages the collection. Only this person can fully edit and manage access.
Automatic refresh: Set how often the collection should refresh automatically (recommended: 30 minutes). This setting is optional. Charts also refresh when the context changes or the page reloads.
Step 4: Configure Sharing Options (Optional)
If you want to share the chart collection with others:
.jpg?cb=877cfabe808d0e8189c3ecdd047b86dc)
-
Check “Team share” – This opens additional sharing options.
-
Choose who can access the collection:
-
Only with team members of this context – Limits sharing to users who have access to the selected hierarchy context.
-
With ALL users – Allows sharing with any user, even if they don’t currently have access to the context. (Note: Users without access will see an empty chart until they switch to a context they can access.)
-
-
Select participants – Start typing names or email addresses to share the collection with specific people.
-
Check “Changes only by owner” if you want others to view the dashboard but not edit it. (Recommended: this prevents accidental changes to your shared version.)
Step 5: Save Your Collection
Click Save to finish creating your chart collection.
You’ll now see your empty collection ready for charts.
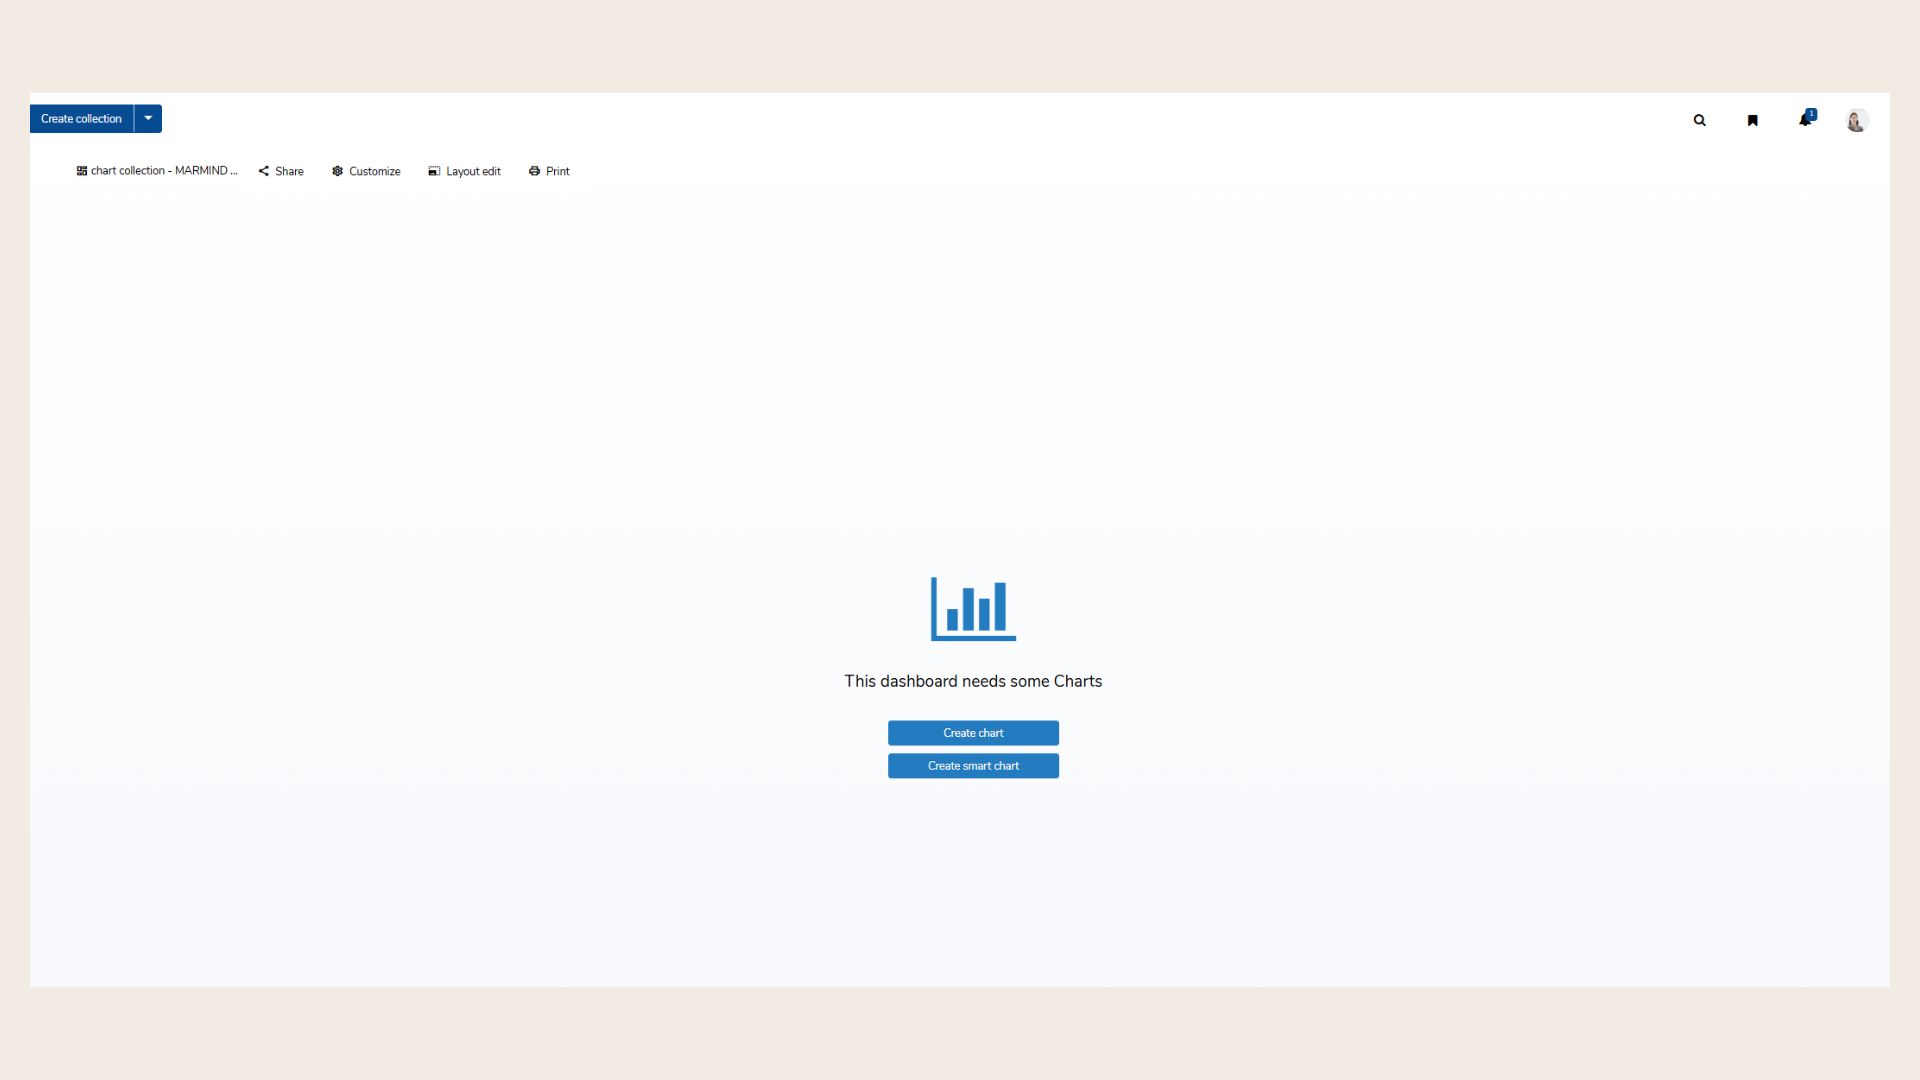
Step 6: Add a Smart Chart (Recommended)
Back in the collection, click the blue button again and select “Create smart chart.”
Smart charts dynamically recalculate based on the selected hierarchy context and are the recommended chart type.
Note: Regular charts have been deprecated in March 2026.
Locate the blue action button in the top-left corner of the Dashboard module. You will see the following options:
-
Create collection – Create a new chart collection to house your charts.
-
Create smart chart – Recommended chart type that dynamically recalculates based on the selected hierarchy context.
-
Create workspace - Create a new workspace.
Only Smart Charts are context-sensitive and automatically adapt to the selected hierarchy. “Chart” type does not dynamically recalculate and may display empty results if the context changes.
❓ FAQs